Weekly Market Insights: Stocks Rally Amid China Stimulus, Earnings in Focus
Happy Sunday!
Here is what we cover this week:
- Weekly Market Overview
- Weekly Sector Update
- Earnings Highlights
- Chart of the Week
- Weekly Market Overview
Weekly Market Overview:
US Equity Indexes Climb Amid China Stimulus Boost, Despite Mixed Inflation Data
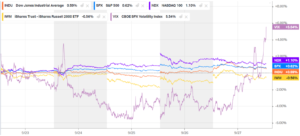
- The Dow Jones closed at 42,313.00 on Friday, up from 42,063.36 last week. The Nasdaq ended at 18,119.59, and the S&P 500 at 5,738.17, both showing slight gains. Basic materials, including aluminum and copper industries, led the US sectors.
- On Thursday, China’s Politburo pledged necessary fiscal spending to meet its 5% GDP growth target and support the property market, following recent monetary easing by the People’s Bank of China.
- US Q2 GDP growth remained unchanged, exceeding expectations. Initial jobless claims also unexpectedly dropped for the week ending Sept. 21, with the four-week average down as well.
- On Friday, the core personal consumption expenditures (PCE) index slowed month-over-month but saw its first annual increase since January 2023. Falling energy costs and goods deflation contributed to the slowdown.
- Following the PCE report, the chances of a 50 basis-point rate cut in November rose to 54.8%, up from 49.3%, while the likelihood of a 25 basis-point cut stood at 45.2%.

Weekly Sector Update
- The market has seen a shift in sector performance over the past week.
- Energy, Financials, and Health Care have declined, while Materials and Utilities have rallied significantly.
- Materials, in particular, have surged to new highs and now lead the market in terms of momentum.
- Industrials and Consumer Discretionary have also shown strength with recent breakouts.
- This rotation within the broader uptrend is a positive sign, especially considering the underperformance of Technology compared to its July highs.
Earnings Highlights
Earnings Announcements: Week of September 22-28, 2024
Progress Software Corporation (PRGS) Q3 2024 Earnings
Financial Performance:
- Revenue: $178.69 million, up 1.7% year-over-year (YoY).
- Earnings per share (EPS): $1.26, beating the consensus estimate of $1.14 by 10.53%.
- Net Income: $33.8 million, up from $29.3 million in the prior-year quarter.
- Subscription revenue: Grew 10% YoY, driven by strong adoption of Progress’ cloud-based offerings.
- Operating margin: Improved to 23.9% from 22.8% in the previous year.
- Cash flow from operations: $47.3 million, down from $51.3 million in the prior-year quarter.
Strategic Initiatives:
- Product innovation: Progress continued to invest in research and development to enhance its product offerings and drive customer value.
- Partnerships and acquisitions: The company expanded its partner ecosystem and completed strategic acquisitions to strengthen its market position.
- Focus on digital transformation: Progress emphasized its commitment to helping customers accelerate their digital transformation journeys.
Source: Trading View
2. AutoZone (AZO) Q4 2024 Earnings
- AutoZone reported Q4 fiscal 2024 earnings of $48.11 per share, a 3.5% year-over-year increase but below the analysts estimate of $53.31.
- Net sales grew 9% year-over-year to $6.20 billion, surpassing the Zacks estimate of $6.18 billion.
- Domestic commercial sales increased to $1.66 billion, with same-store sales up 0.2%.
- Gross profit rose to $3.26 billion, and operating profit grew 5.7% to $1.29 billion.
- AutoZone opened 68 new stores in the US, 31 in Mexico, and 18 in Brazil, bringing its total store count to 7,353.
- The company repurchased 244,000 shares for $710.6 million, with $2.2 billion remaining for future buybacks.

Source: Seeking Alpha
3. KB Home (KBH) Q3 2024 Earnings

Source: Seeking Alpha
Chart of the Week
Is AMD breaking out ?
AMD stock price appears to be forming a descending triangle pattern. This pattern suggests a potential bearish breakout, but a break above the upper trendline could signal a bullish reversal.
The RSI is currently hovering near the oversold level, indicating that the stock might be due for a rebound.
The 50-day and 200-day moving averages are currently converging. A crossover of these moving averages could provide a signal of a potential trend change.
A break above the upper resistance level @ 163 could lead to further gains.
Pay attention to trading volume. A significant increase in volume during a breakout or breakdown can confirm the strength of the move.

Source: Trading View
Disclaimer: The information provided on this page is for general informational purposes only and is not guaranteed for accuracy or completeness. All views expressed are solely those of the author, and do not represent any official policy or position of any organization.
The Quant Post is a publisher of financial information, not an investment advisor. We do not provide tailored investment advice. Readers should use their own judgment and seek additional sources when necessary.
This content, partially created using an AI model, is not intended as investment advice and should not be relied upon for making financial decisions. Investors should conduct their own research on any securities mentioned.
No part of this content is an offer or solicitation to buy or sell any securities. Any forward-looking statements are speculative and may not reflect actual outcomes.
We do not accept liability for any losses resulting from the use of this information.
By using this site, you agree to this disclaimer. Unauthorized reproduction of this content is prohibited.


